Author: NEDU
PDF 7MB
Over 300 Illustrations Inside – Special Launch Price!
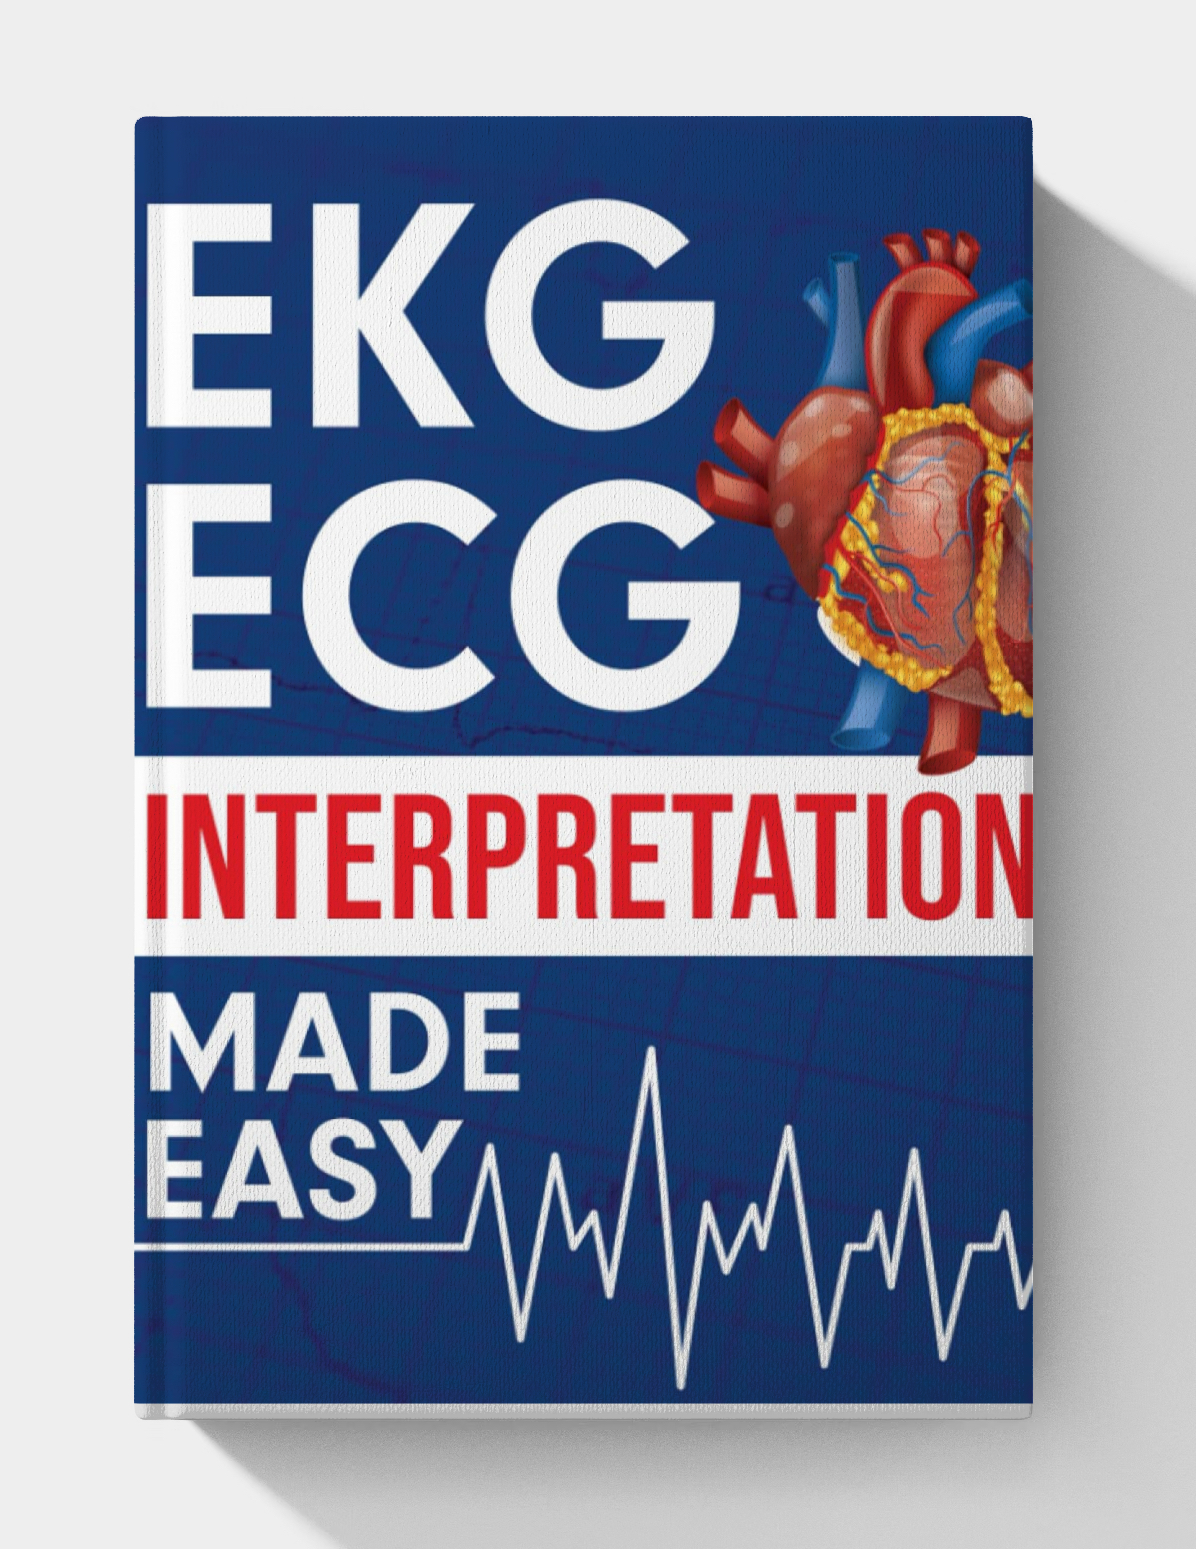
Electrocardiograms (or “ECGs”) can seem very daunting when you first try to read them. There are so many squiggles, often visualized in six different “boxes” on the ECG interpretation page. You’ve been told that those squiggles mean something important about the heart—but what? In this guide, you will understand how ECGs are performed, what they represent about the heart, and what it means to see something you don’t think is normal.
Before you get into the hard stuff—the actual interpretation of ECGs, and what to do about what you’ve read—you’ll study the source of the ECG, which is the heart. By reviewing what this important organ looks like and does every moment of your life, you’ll see how those ECG lines get generated and what exactly they mean.
Then we’ll talk about how the ECG is generated and how you obtain an ECG. What is the difference between a “rhythm strip” and a 12-lead ECG, for example? What is a P wave or a QRS complex? After you learn these, you’ll be ready to interpret what you see on an ECG reading.
The rest of the guide gives you the tools to read any ECG and know what it means. We’ll cover all sorts of arrhythmias as well as ECG evidence of ischemia and infarction. We’ll also talk about what you need to know concerning how drugs and electrolyte abnormalities affect the heart, and what kind of ECG you’ll see under such influences.

